
Introduction: When “Capturing Demand” Is the Strategy
Some categories aren’t about inventing new demand — they’re about capturing a slice of demand that already exists. That’s often the case on marketplaces like Amazon and in commodity or well-established categories. For these brands, a market share-based forecast is the most natural fit.
👉 This blog is part of our forecasting series, which also includes deep dives into Website-Based Forecasting, Store-Based Forecasting, Customer-Based Forecasting, and Cohort-Based Forecasting. For a complete overview of all methods, check out our parent guide: The Essential Guide to Revenue Forecasting for Your Startup Food or CPG Business.
What Is Market Share-Based Forecasting?
You project revenue by anchoring to category size and the share you can realistically capture.
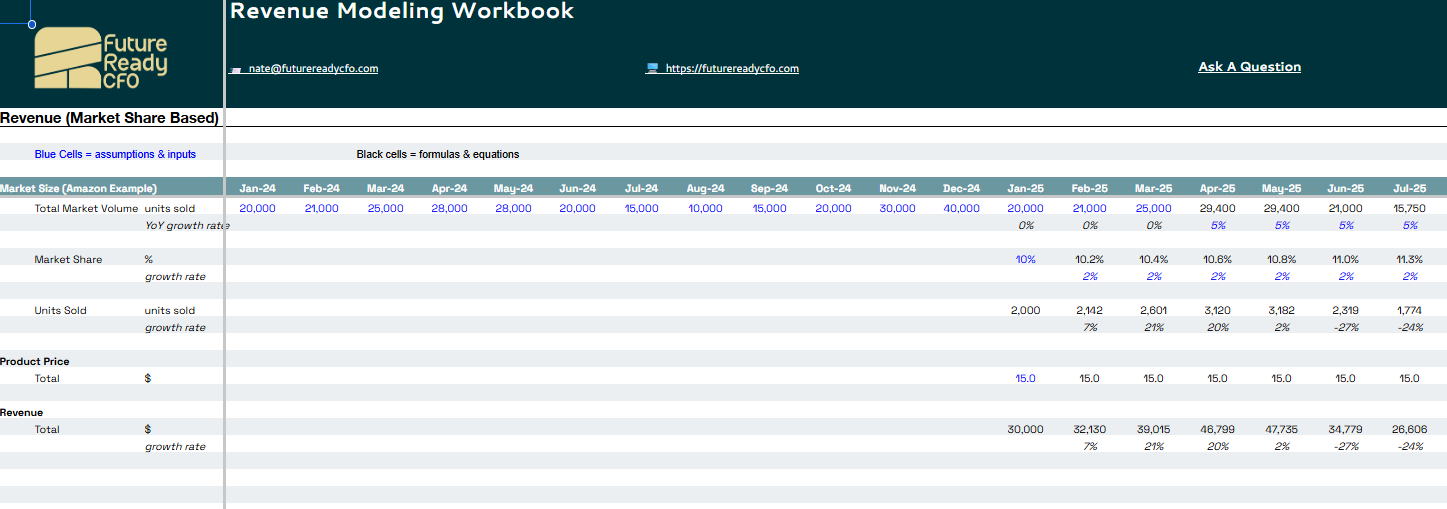
Revenue = Market Size (units) × Market Share % × Price per Unit
- Market Size (units): The total demand in your category during a period (e.g., month/season/year).
- Market Share %: The slice you expect to win.
- Price per Unit: Your effective selling price for the period.
This method is ideal when you’re not creating demand (new concepts, education-heavy products) but instead competing to win more of the existing pie.
When This Method Works Best
- Commodity or Established Categories: Shoppers already know what they want (e.g., OJ, hair dryers).
- Marketplace-Led Sales (e.g., Amazon): The platform aggregates demand; your job is to capture it.
- Highly Seasonal Products: Category size swings throughout the year (e.g., Halloween, gardening, gifting). Market-based modeling makes those peaks and troughs explicit.
Sample Computation
A Halloween costume brand models a key period:
- Market Size: 20,000 units
- Target Market Share: 10%
- Price per Unit: $15
Units Sold = 20,000 × 10% = 2,000
Revenue = 2,000 × $15 = $30,000 (for the modeled period)
Small changes matter a lot:
- If market size rises to 22,000 units, revenue at the same 10% share becomes $33,000.
- If your share grows to 12% at 20,000 units, revenue becomes $36,000.
- If both happen (22,000 units × 12%), revenue climbs to $39,600.
How to Build a Market Share-Based Forecast (Step-by-Step)
- Map Category Volume by Period
- Gather monthly or weekly category volume (units) to capture seasonality.
- Use marketplace intelligence tools and search trend data to see when demand spikes.
- Project Category Growth
- Extend volume forward using a baseline growth rate (e.g., +5% YoY) if historical data supports it.
- Keep seasonality intact (peaks remain peaks, just scaled).
- Set Your Market Share Curve
- Start conservative, then ramp share as you improve listings, reviews, placements, ads, and availability.
- Model scenarios (base/upside/downside) to reflect competition and execution risk.
- Apply Price per Unit (or Net Realized Price)
- Use the expected price for each period.
- If promotions or discounts are planned in peak months, reflect them here.
- Calculate Units & Revenue
- Units = Market Size × Share
- Revenue = Units × Price
- Reconcile Monthly
- Each month, compare forecast vs. actual and adjust market size, share, or pricing assumptions.
Why Founders Like This Method
- Reality-Checked: Grounds your plan in the size of the pie, not wishful thinking.
- Seasonality-Smart: Shows when demand exists, not just how much.
- Competitive Compass: Tracking share over time reveals whether you’re gaining or losing ground vs. peers.
Practical Tips & Data Sources
- Category Volume: Pull from marketplace intelligence tools; complement with search trend data to visualize seasonality.
- Share Targets: Calibrate with current rank, reviews, ad coverage, and distribution strength; ramp share as those improve.
- Price: Use the effective price for each period (after promos), not just the list price.
- Granularity: Model by subcategory or keyword cluster if your assortment spans different demand pockets.
Strengths and Limitations
Strengths
- ✅ Excellent for Amazon/marketplace and seasonal categories
- ✅ Forces alignment with external reality (category size and timing)
- ✅ Great for scenario planning (bigger market, better share, promotional price)
Limitations
- ❌ Requires access to credible category data
- ❌ Less useful for categories where you’re creating net-new demand
- ❌ Can mask operational issues if you ignore stockouts or listings that block you from capturing share
Simple Seasonal Illustration
Suppose your category’s monthly units look like this (indexing seasonality):
- Spring: 120, 140, 160
- Summer: 80, 70, 75
- Fall: 110, 130, 300 (Halloween spike)
- Winter: 90, 95, 100
Apply your expected share curve (e.g., 6% climbing to 10–12% in peak with heavier promotions) and a realistic price per unit by month. The output shows when to lean in (inventory, ads) and where to conserve cash.
Conclusion
Market share-based forecasting is perfect when your job is to win a bigger slice of a known pie. It captures seasonality, provides a competitive benchmark, and helps you plan inventory, pricing, and promotions around when demand actually exists.
👉 This blog is part of our forecasting series, which also includes Website-Based Forecasting, Store-Based Forecasting, Customer-Based Forecasting, and Cohort-Based Forecasting methods. For the complete overview, visit our parent guide: The Essential Guide to Revenue Forecasting for Your Startup Food or CPG Business.
Want more like this?
Join our newsletter list and every Thursday morning you can look forward to actionable insights and free tools for scaling your brand.
We hate SPAM. We will never sell your information, for any reason.
