
Introduction: When You Need the Most Nuanced View of Growth
Cohort-based forecasting is the most detailed method in the toolkit—and for good reason. It lets you see how each group of customers you acquire behaves over time, so you can separate the impact of new customer acquisition from retention and AOV improvements.
👉 This blog is part of our forecasting series, which also includes deep dives into Website-Based Forecasting, Store-Based Forecasting, Customer-Based Forecasting, and Market Share-Based Forecasting. For a complete overview of all methods, check out our parent guide: The Essential Guide to Revenue Forecasting for Your Startup Food or CPG Business.
What Is Cohort-Based Forecasting?
You group customers into cohorts by their first purchase month (Jan cohort, Feb cohort, etc.). For each subsequent month, you estimate what share of that cohort returns and how much they spend.
At a high level:
- Define cohorts: customers first converting in Month t.
- Model returning behavior: apply a retention rate for each cohort in Month t+1, t+2, … (these rates can decay over time).
- Apply AOVs: optionally use different AOVs for new vs returning purchases.
- Sum across cohorts each month to get total customers and revenue.
This framework cleanly separates new from repeat revenue and shows how changes in retention and AOV compound.
A Simple Walk-Through (Numbers That Mirror a Realistic Setup)
Setup
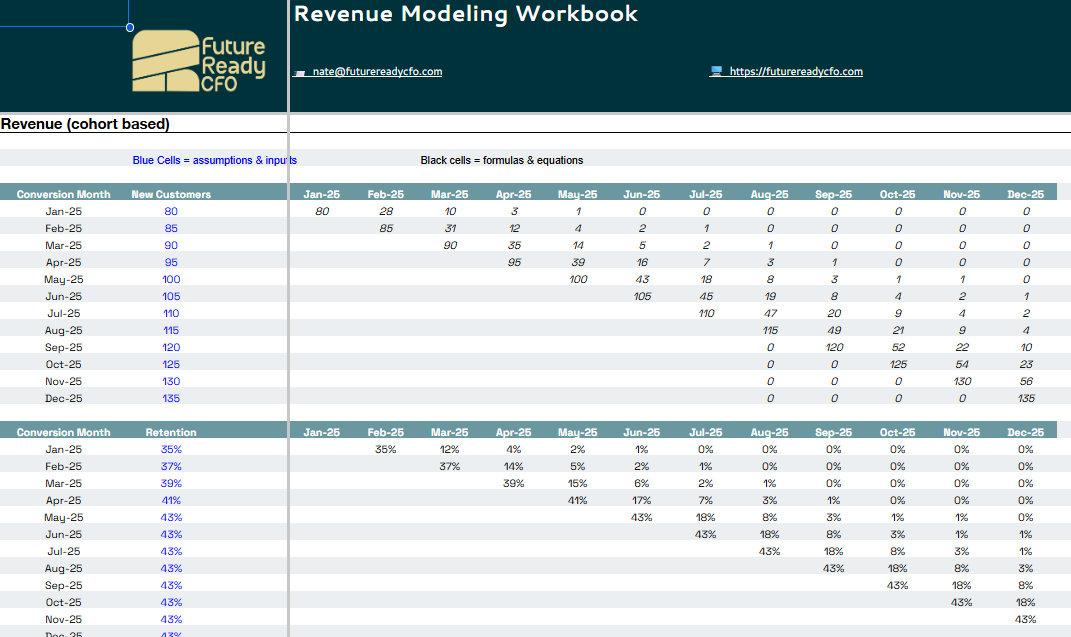
- January acquires 80 new customers.
- February acquires 85 new customers and 35% of January’s cohort returns (that’s 28 returning).
- March acquires 90 new customers; a portion of February’s cohort returns, and a smaller portion of January’s returns again.
Month-by-month customer counts
- January: 80 (all new)
- February: 85 new + (80 × 35%) = 113 total
- March: 90 new + (Feb returns) + (Jan returns, smaller than Feb’s due to decay)
Multiply each month’s Total Customers × AOV to get Revenue. You can keep it simple with one AOV, or model separate AOVs (e.g., new = $100, returning = $80) if your data supports it.
Why This Method Is Powerful
- Separates acquisition vs. retention: See exactly whether growth comes from more ads/new doors—or from better lifecycle marketing.
- Shows compounding: Modest improvements in retention cascade across many cohorts.
- Precision for initiatives: If you’re launching post-purchase flows, new SKUs, bundles, or upsells, you can isolate their effect by improving returning AOV or specific month-over-month retention steps.
Visual Intuition: “Pancake Stack” Cohorts
Imagine each cohort as a horizontal “layer.”
- With very high retention, layers stay thick as they move across months—revenue stacks up from many active cohorts.
- With moderate retention (e.g., ~35%), layers thin as cohorts age—new customers drive a larger share of monthly revenue.
- With near-zero retention, layers are almost vertical—revenue growth depends almost entirely on acquiring more new customers each month.
This makes it instantly clear whether you should focus on acquisition or retention/AOV to hit the plan.
How to Build Your Cohort Forecast (Step-by-Step)
- Create rows for cohorts
- One row per first-purchase month (Jan, Feb, Mar…).
- A column for each subsequent month to track returns.
- Populate new customers
- From your acquisition plan (e.g., derived from paid spend ÷ CAC or channel targets).
- Layer in retention
- Apply return rates for Month +1, +2, +3, etc.
- Use a simple decay curve to start; refine with your historicals.
- Add AOV assumptions
- Start with a single AOV, or split new vs. returning (returning often differs due to bundles, replenishment, or promos).
- Calculate monthly totals
- Customers (new + returning) → Orders (if not 1:1) → Revenue = Orders × AOV.
- Scenario and sensitivity
- Increase Month +1 retention by 5 pts and see the impact on annual revenue.
- Test a $5 bump in returning AOV via bundles/upsells.
- Reconcile monthly
- Compare forecast to actuals. Tighten retention curves and AOVs as new data comes in.
Where to Get the Data
- Commerce platforms: Shopify’s cohort/first-purchase over time reporting gives you the historic spine you need.
- Analytics/CRM: Email platform and lifecycle analytics (e.g., flows, replenishment cadence) help estimate realistic return curves.
- Your paid plan: New customer counts often tie back to CAC-based acquisition models.
Best Practices
- Start simple: One retention rate and one AOV per cohort is enough to get moving; add granularity (e.g., Month +1 vs +2 rates) once you’re reconciling cleanly.
- Model initiatives explicitly: If you’re launching a replenishment SKU or post-purchase sequence, reflect that as higher Month +1/+2 retention or a higher returning AOV starting in the target month.
- Guardrails for realism: Retention rarely improves without a causal action (better product availability, new SKUs, email/SMS, loyalty). Tie the assumption changes to initiatives.
Strengths and Limitations
Strengths
- ✅ The clearest way to quantify retention’s contribution to revenue
- ✅ Perfect for repeat-purchase categories and brands with lifecycle programs
- ✅ Turns lifecycle projects (bundles, flows, subscriptions) into measurable upside
Limitations
- ❌ More complex to maintain than single-equation models
- ❌ Requires clean data to set baseline retention/AOV curves
- ❌ Over-granularity can slow monthly reconciliation—keep it lean
Conclusion
Cohort-based forecasting gives you forensic clarity on who is driving revenue—new customers or returning cohorts—and why. If you’re investing in lifecycle marketing, replenishment SKUs, or upsells, this is the model that will show the payoff clearly and help you prioritize the next retention or AOV lever to pull.
👉 This blog is part of our forecasting series, which also includes Website-Based Forecasting, Store-Based Forecasting, Customer-Based Forecasting, and Market Share-Based Forecasting methods. For the complete overview, visit our parent guide: The Essential Guide to Revenue Forecasting for Your Startup Food or CPG Business.
Want more like this?
Join our newsletter list and every Thursday morning you can look forward to actionable insights and free tools for scaling your brand.
We hate SPAM. We will never sell your information, for any reason.
